


Results and Performance

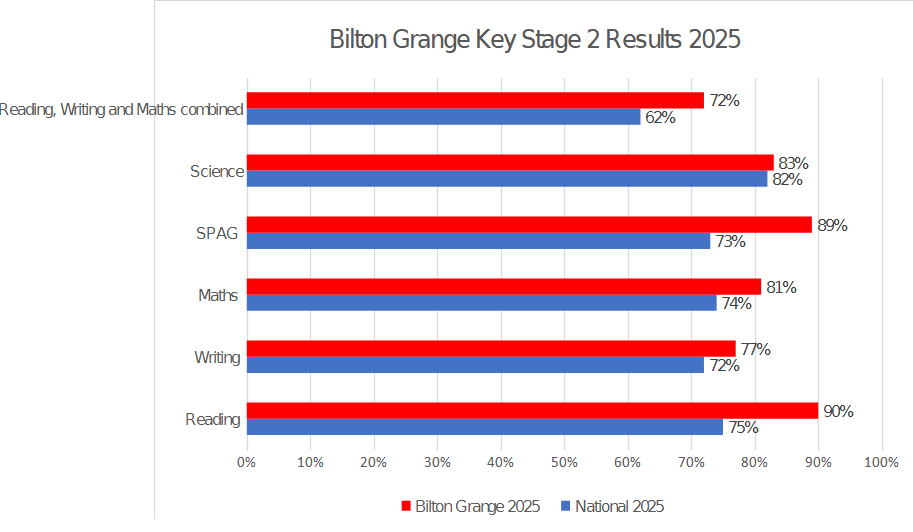
Upper Key Stage 2
Percentage of Year 6 pupils reaching the expected level 2025.
| Subject | National 2025 (average scaled) | Bilton Grange 2025 (average scaled) |
|---|---|---|
| Reading | 75% (106) | 90% (106) |
| Writing | 72% | 77% |
| Maths | 74% (104) | 81% (104) |
| SPAG | 73% (105) | 89% (107) |
| Science | 82% | 83% |
| Reading, Writing and Maths combined | 62% | 72% |
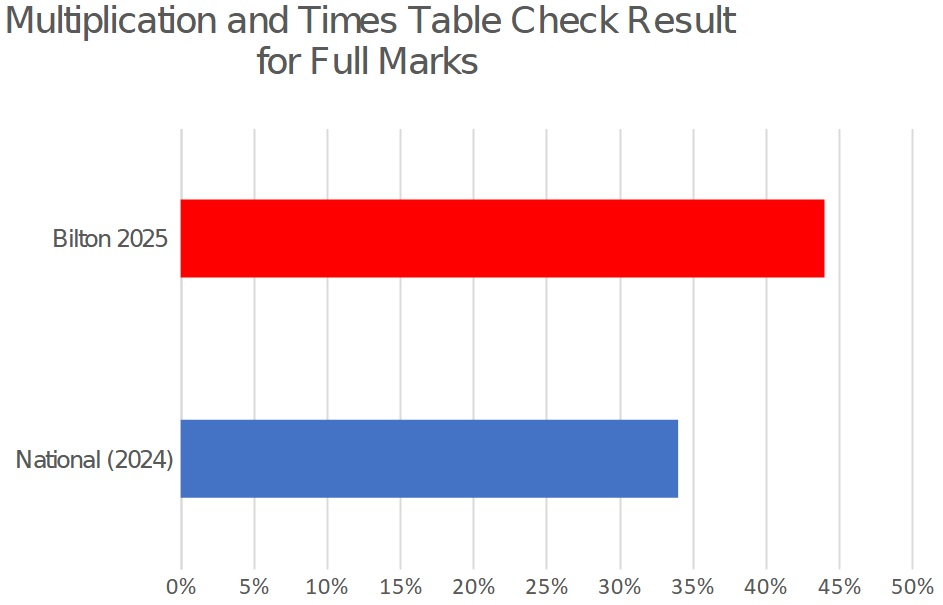
Lower Key Stage 2
Percentage scoring full marks and average score of Year 4 pupils on the Multiplication and Times Table Check 2025. National percentage is 2024 data; national 2025 data will be published in November.
| National (2024) | Bilton (2025) | |
|---|---|---|
| Full marks (25/25) | 34% | 44% |
| Average | 20.6% | 22.6% |
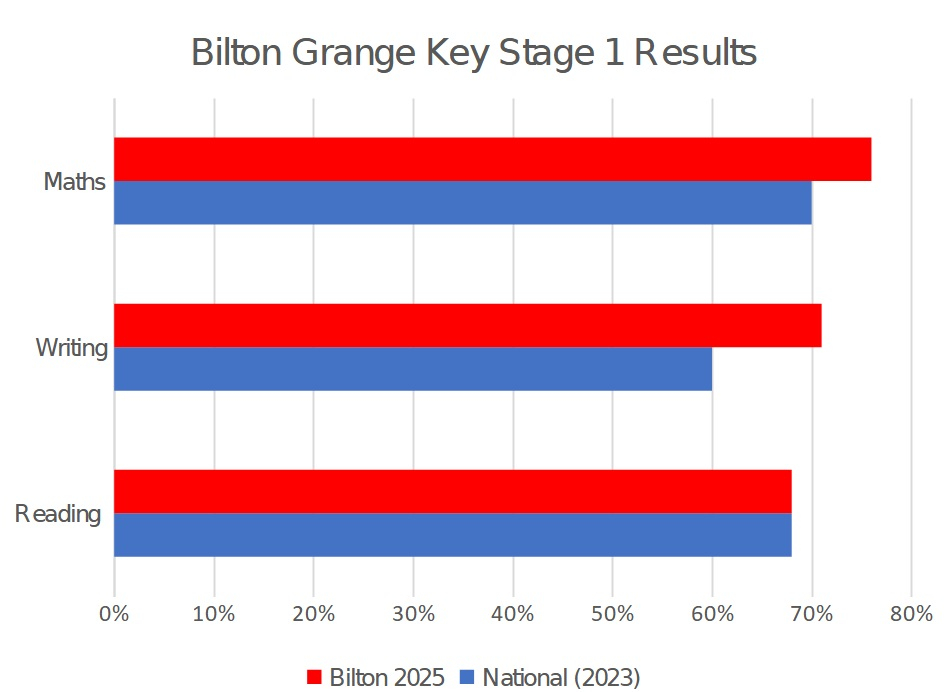
Key Stage 1
Percentage of Year 2 pupils reaching the expected level. National percentage is 2023 data – national data is no longer published.
| National (2023) | Bilton (2025) | |
|---|---|---|
| Reading | 68% | 68% |
| Writing | 60% | 71% |
| Maths | 70% | 76% |
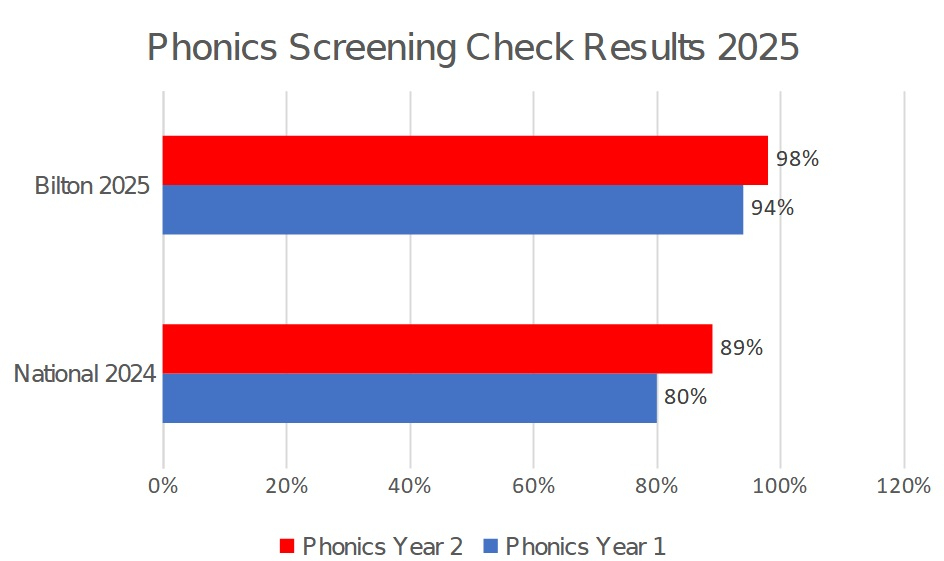
Key Stage 1 Phonics
Percentage of pupils reaching the expected level in the Phonics Screening Check. National percentage is 2024; national data for 2025 will be published by November 2025.
| National 2024 | Bilton 2024 | |
|---|---|---|
| Phonics Year 1 | 80% | 94% |
| Phonics Year 2 | 89% | 98% |
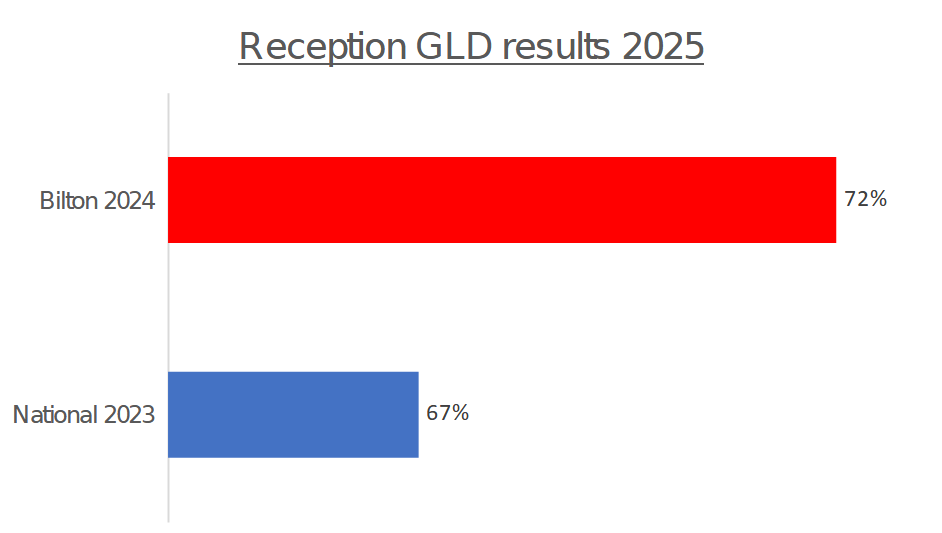
Reception
Percentage of Reception pupils reaching a good level of development.
| National 2023 | Bilton 2024 | |
|---|---|---|
| Pupils reaching a good level of development | 67% | 81% |